
The Inflation Reduction Act (IRA) creates and extends billions of dollars of tax credit incentives for decarbonization of the U.S. energy sector. Central to this legislation are the Investment Tax Credit (ITC) and Production Tax Credit (PTC), designed to spur investment in clean energy projects. Estimates for the total value of ITC and PTC funding from the IRA range across sources, but the Congressional Research Service estimated the combined value of the ITC and PTC at $156 billion in 2022.1
A crucial component of this initiative is the Energy Communities Tax Credit Adder, which can boost the established ITC or PTC incentive by an additional 10%.
E3 has analyzed data on all electricity generation projects under construction in the U.S. and recently published census tract qualification data released by the U.S. Treasury Department to identify emerging trends in project qualification for this Adder. E3 finds that 57% of zero-emission generation capacity being built in the U.S. qualifies for the Adder, with significant geographic variation.
Context: How Does the Energy Community Adder Work?
The Energy Community Tax Credit Adder increases the value of the Investment Tax Credit for a qualified project by 10 percentage points (i.e., from 30% to 40%), and increases the value of the Production Tax Credit for which the project is eligible by 10%. A new clean electricity facility may qualify for the Energy Community Adder by meeting one of the following criteria:
- Mine Communities: A project must be located in a census tract, or adjacent to one, that has had, a mine closure after 1999.
- Fossil Fuel Employment: Project must be in a Metropolitan Statistical Area (MSA) where 0.17% of employment relies on fossil fuels and the unemployment rate exceeds the national average. MSAs may also qualify if more than 25% of their tax revenues derive from fossil fuel activity.
- Brownfield Sites: Projects must be located on smaller sites which the Environmental Protection Agency has designated as polluted. Brownfield Sites are not included in E3’s analysis described here.
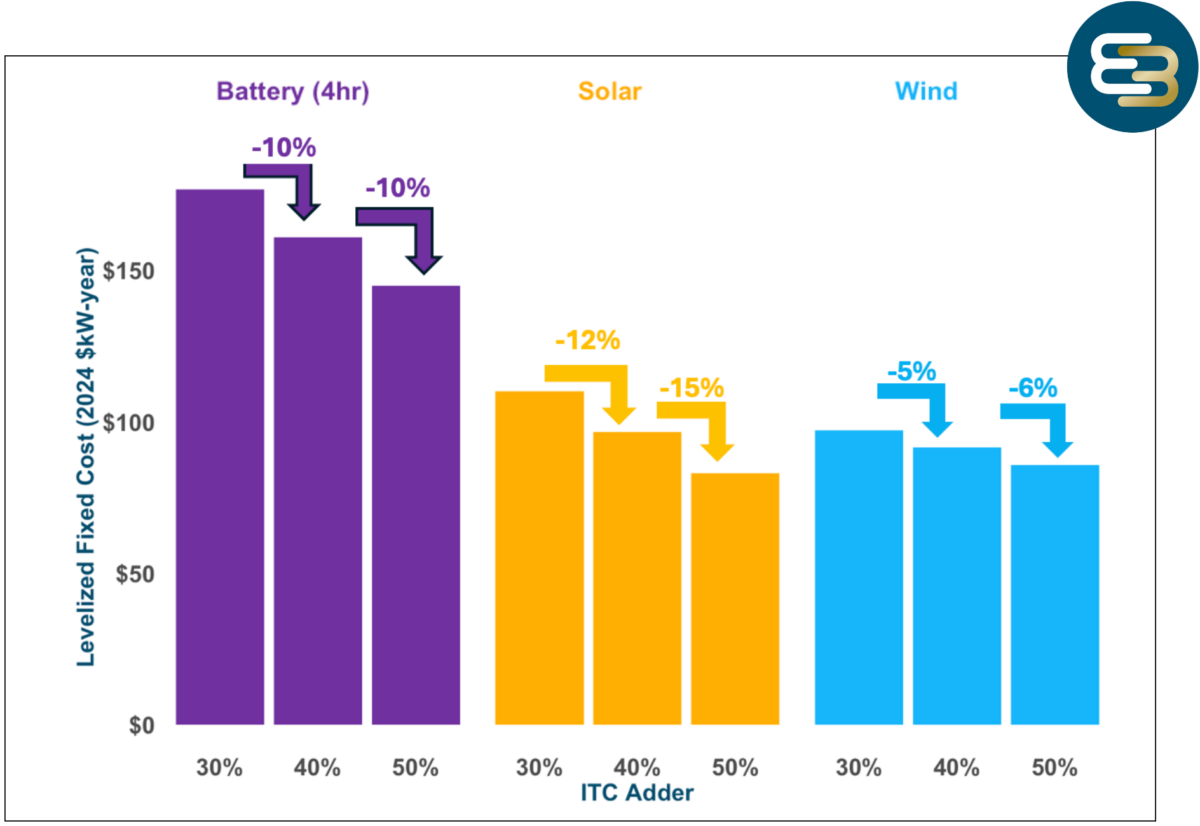
The Energy Community Adder has a significant impact on new solar and battery projects. According to E3 analysis using our RECOST model, this Adder can reduce the levelized fixed cost of a solar plant by $12.5 per kW-year. For a 100 MW solar plant utilizing the Investment Tax Credit (ITC), this translates to annual cost savings of $1.25 million. In comparison, wind projects experience a less dramatic reduction in their levelized fixed costs, with savings of up to $4 per kW-year for each 10% increment in the ITC.
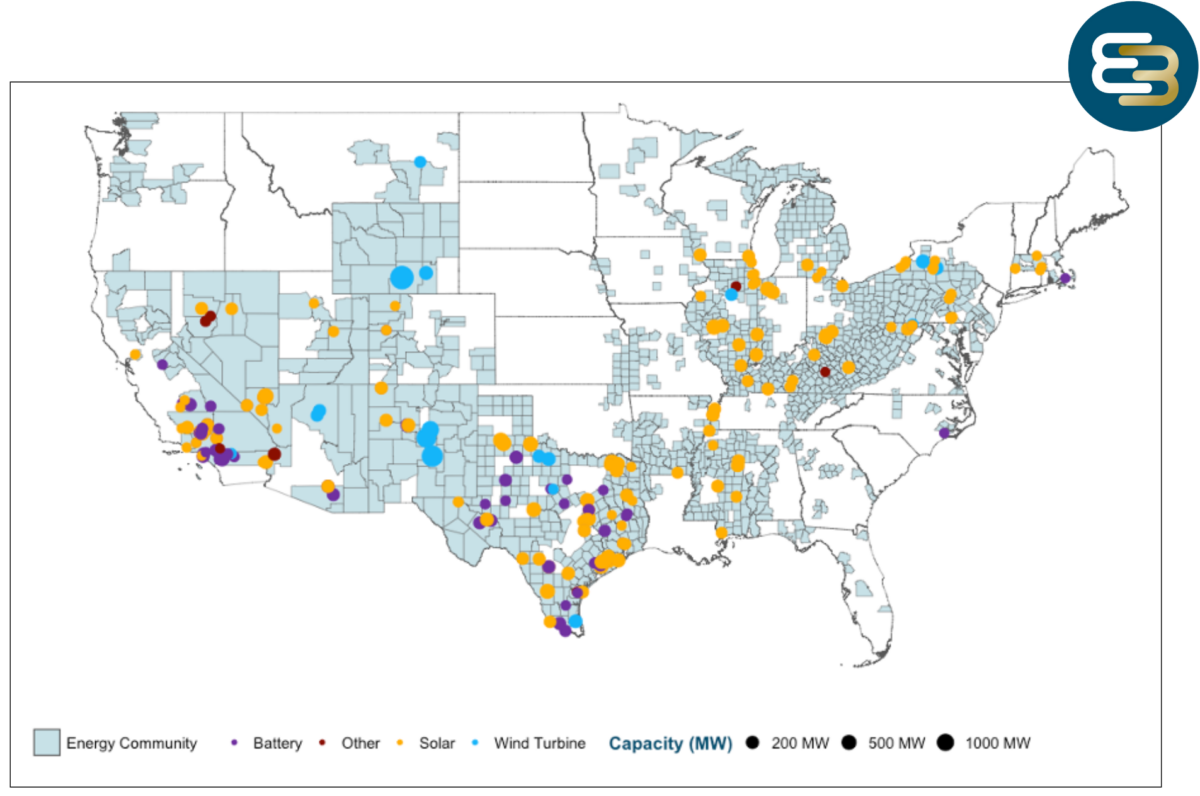
Emerging Currents: Texas Solar Shines and the West Beckons
Texas and California lead all states in attracting eligible renewable energy projects in energy communities with a combined 26 GW of construction, more than half of which is solar. Both states expect significant growth of demand, with ERCOT forecasting roughly 152 GW of new load by 2030 while California expects load to increase by 1.8% per year by 2030. Data centers drive a large share of this expected growth, and companies that build data centers tend to have carbon emission targets for which they require renewable energy to match new load.
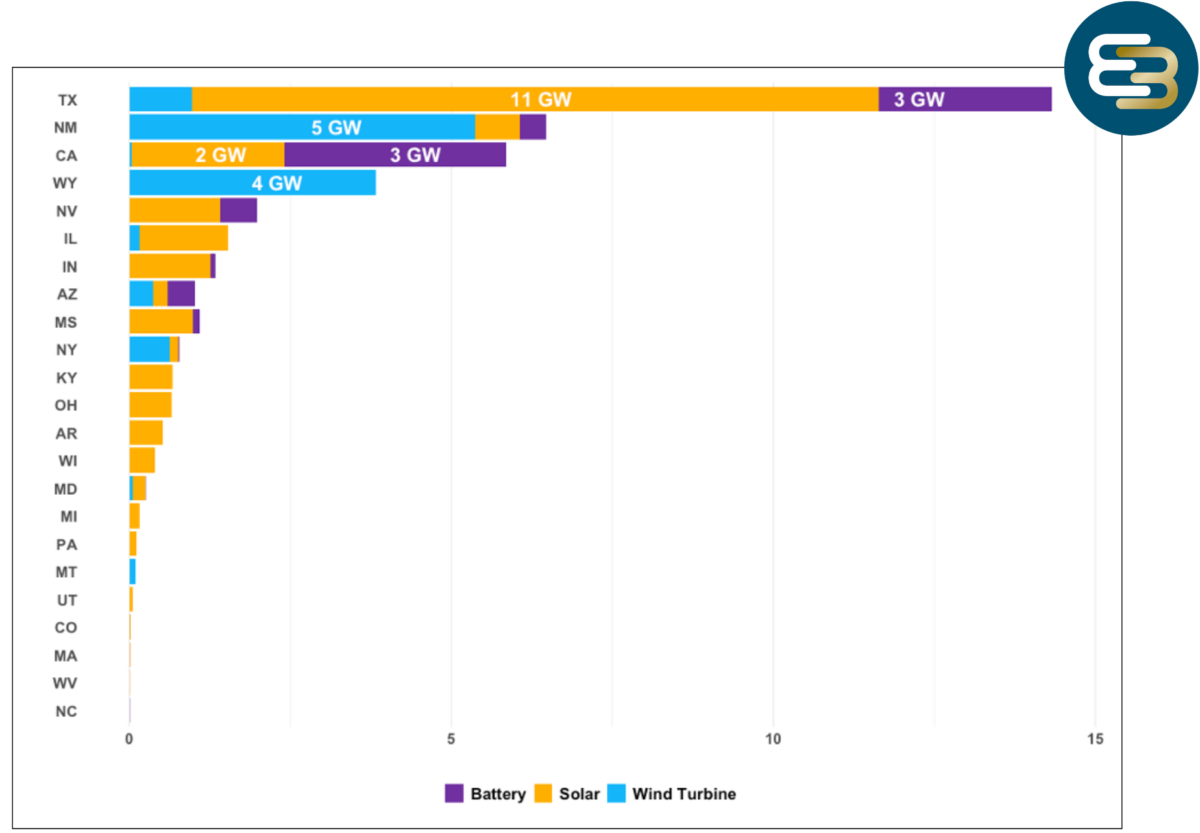
New Mexico and Wyoming come out on top for wind construction within energy communities. Both states are host to new large-scale transmission lines that will enable multiple GigaWatts (GW) of new clean electricity to be delivered to neighboring states such as California.2 Both states also have only two counties with no Energy Community tracts.
Apprenticeship Requirement
While the Energy Community Adder is a material benefit to project developers, it is less valuable than the multiplier from meeting Prevailing Wage and Apprenticeship requirements, which increases the ITC from 6% to 30% and similarly multiplies the PTC by five. To qualify for this, developers must hire a sufficient proportion of workers from a registered apprenticeship program. At least 10% of the labor force engaged in facility construction and repair work must be apprentices, with this requirement increasing to 15% over time. Developers must also pay workers the local prevailing wage for a five-to-twelve-week period.
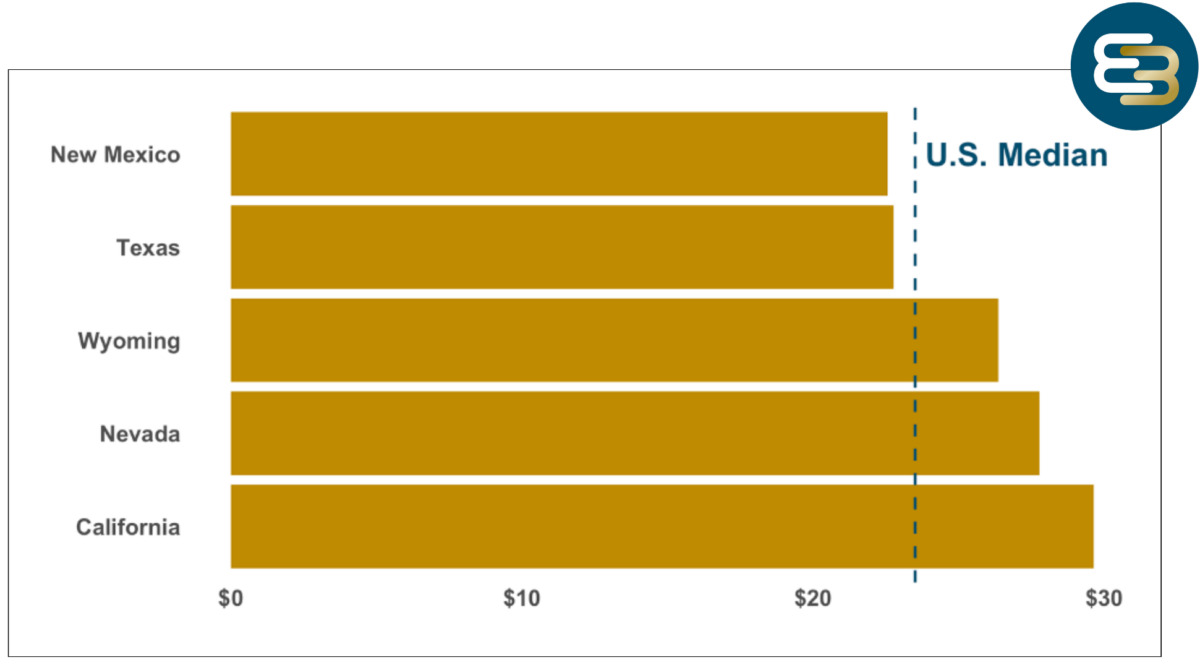
E3 has examined Bureau of Labor state-level statistics on job salaries relevant to extraction, construction, installation, and production occupations and found that, on average, lower-cost labor is more likely to be correlated with project siting in New Mexico and Texas, which fall approximately $2 below the national median wage per hour.3
Qualification Risks
Currently, about 69% of capacity qualifying for the Energy Community Adder qualifies due to the fossil fuel employment standard. This criterion is updated every year, meaning that projects seeking to qualify based on this criterion are exposed to greater risk than projects which qualify due to the mine community standard. This may lead to a preference for ITC when the project is reliant upon Energy Community status based on the MSA criteria, as this must only be proven once for ITC purposes, but annually for PTC purposes.4
Looking Ahead
The Energy Community Adder provides an additional boost to the current clean energy construction wave in the U.S. Its cost savings can drive more renewable energy development in the relevant communities. Looking ahead, it will be essential for policy makers, investors, developers, and utilities to gauge the impact of this Adder by continuing to:
- Analyze the evolving relationship between projects currently in interconnection queues across the U.S., projects that enter the interconnection queue moving forward, and their incidence in energy communities;
- Explore the extent to which tax credits can lower PPA prices, and the shape of this relationship;
- Investigate how tax credits generally and Adders in particular can offset interconnection costs especially in the context of customer affordability; and
- Delve deeper into the impacts and interaction effects of the IRA wage and apprenticeship requirements with Adder credits.
E3 provides expertise to guide investment decisions with deep expertise across all energy markets in America, on topics including but not limited to the impacts of the IRA on development. We also provide long-term energy price, capacity, load, and generation forecasts for all regions in the U.S. For more information, see our website and please contact market.prices@ethree.com
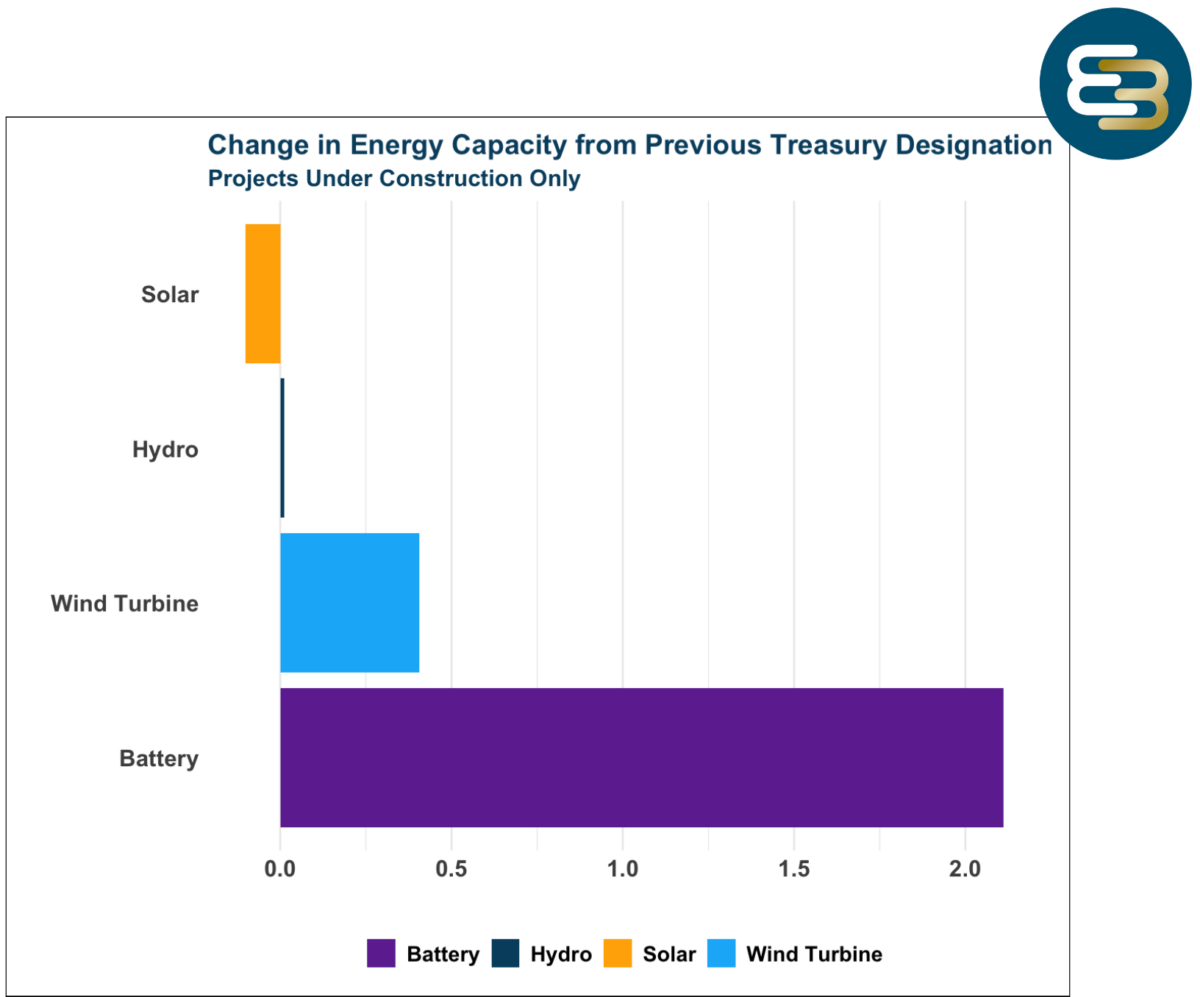
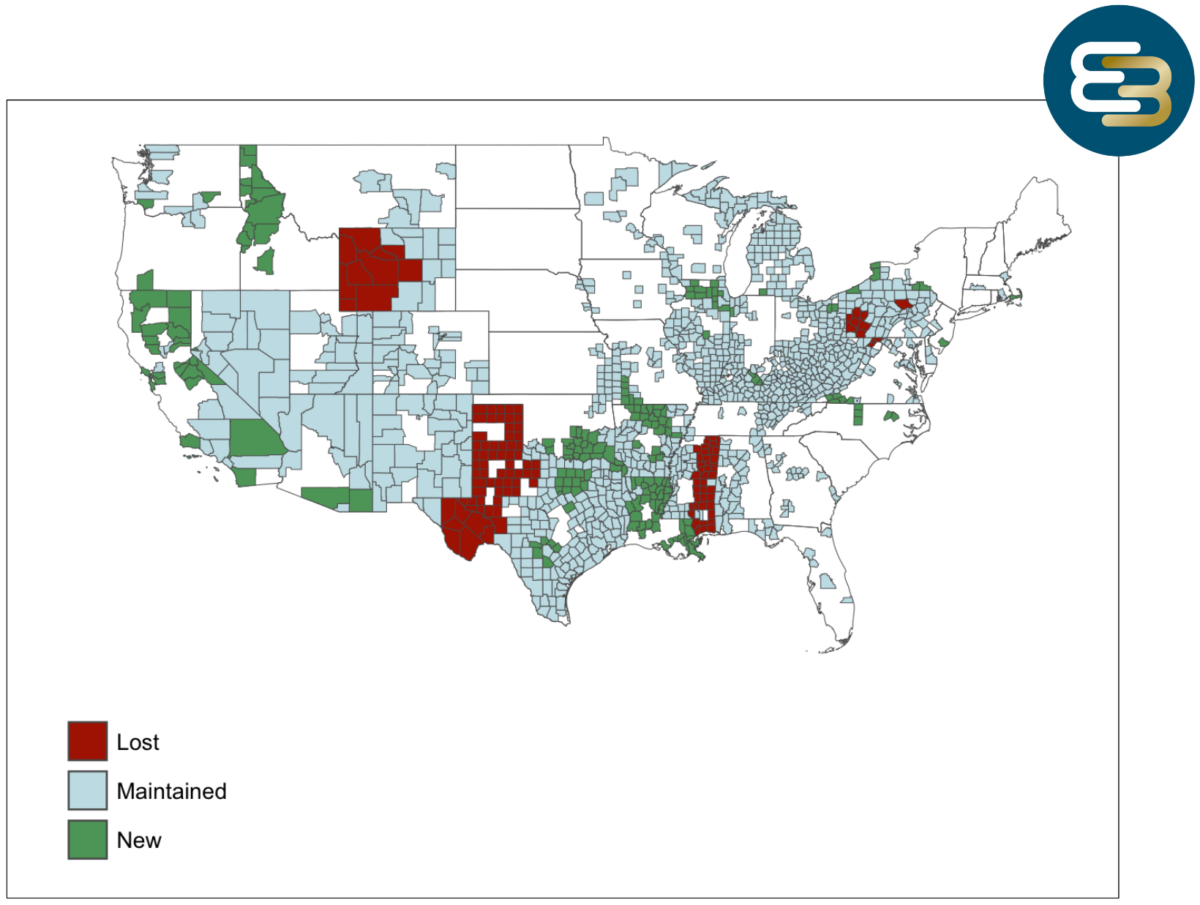
June 14, 2024 Update: After preparing and publishing this analysis, the U.S. Treasury Department released updated guidance on the list of communities qualifying for the Energy Community Bonus Credit. E3 has assessed the changes in counties gaining, losing, or maintaining the same number of census tracts qualifying for the Credit, as well as the changes in qualifying capacity under construction, in the Figures below.
Note: E3 created this analysis using the best available public information and our expertise and knowledge of the relevant markets, along with proprietary in-house forecasting tools. However, the future is uncertain, and these forecasts (along with underlying market expectations) may change due to many factors, including unforeseen events, new technology adoption or inventions, new market structures, regulatory actions, and changes in both state and federal government policies. E3 makes no guarantees related to these forecasts or the information presented herein and should not be held liable for any economic damages associated with independent investment decisions
Written and researched by Andy Theocharous, Gregory Gangelhoff, and Kush Patel.
- Includes the extension of existing incentives, the creation of a zero-emission nuclear power production credit (Subtitle D, Part I), and the creation of technology-neutral incentives for clean electricity (Subtitle D, Part 7). For more detail, see Table 5. ↩︎
- Sunzia and TransWest. ↩︎
- E3 examined job titles with a job description of the following NAICS descriptions:
-Construction and Extraction Occupations,
-Installation, Maintenance, and Repair Occupations
-Production Occupations
While the IRS has yet to release qualified descriptions, taxpayers who wish to claim the adder must show proof that apprentices perform work related to construction, alteration or repair. E3 used the above codes that it deemed to be closer to qualifying occupations. More information from the IRS is found here. ↩︎ - See here. ↩︎